
Cropwise Financials
Improving Property Management to Facilitate Easy Onboarding
Syngenta's farm management platform required growers to build a digital representation of their farm before ROI could be calculated. In trial demos, users felt the product was too unintuitive, causing the business to postpone launching. It was critical to fix these issues before the growing season started; missing that window would be detrimental to the product's success. We needed to identify the most critical issues and fix them before the growing season started.
Client
Syngenta
Industry
Agriculture


Digital & Customer Success leadership felt product onboarding was too difficult and wanted to fix it before releasing to potential customers
Financials is a farm management product that helps growers calculate their ROI. Property management was too difficult for growers to start using, putting the product at risk of low adoption during a critical point in the fiscal year. My role was to diagnose the cause of the issues and lead the redesign before the product was released.
Usability testing revealed property management workflows lacked the basic controls necessary for large farm operations to effectively start using the product
I conducted usability tests on the most critical onboarding tasks to understand if growers could actually create a farm and begin calculating ROI. With a 60% failure rate, I learned there were 3 reasons why the product didn’t properly support large farm operations:
Multi-crop fields were not supported, preventing growers from accurately representing their ROI per field
Navigating farms was difficult, especially for complex orgs with hundreds of fields
Crop performance was not tied to seasonal timeframes; a severe misalignment for how growers expected to visualize and manage farm data

Our biggest challenge was organizing data to reflect how real farms operated. I facilitated workshops to define how we should view data by seasonal timeframes, a new paradigm that would help us properly redesign the product
I led a cross-functional workshop with Product, Engineering, and Customer Success to restructure our data around seasonal timeframes to allow growers to see how their farm performed over time. Once we were aligned, I redesigned the map architecture and field creation workflows around viewing seasonal timeframes. We gave growers filters to see their farm activity during specific time frames tied to the lifecycle of the crops they grew during that time; a paradigm that aligned with their mental model for how they managed their farms.

We rebuilt workflows that let growers represent field ROI with greater accuracy, navigate large farms with ease, and filter data by operational timeframes, making a more intuitive onboarding experience for prospective customers.

File uploads for existing field data allowed growers with existing field data to start using the product without starting from scratch

The Farm-Field Tree was a new navigational model giving growers visibility across their farm hierarchy and meeting modern agricultural product standards

Rebuilt drawing tools to support multi crop fields and allow for more accurate ROI calculations per field

A global season filter allowed growers to view current and historical activity in the timeframe that matched their operations
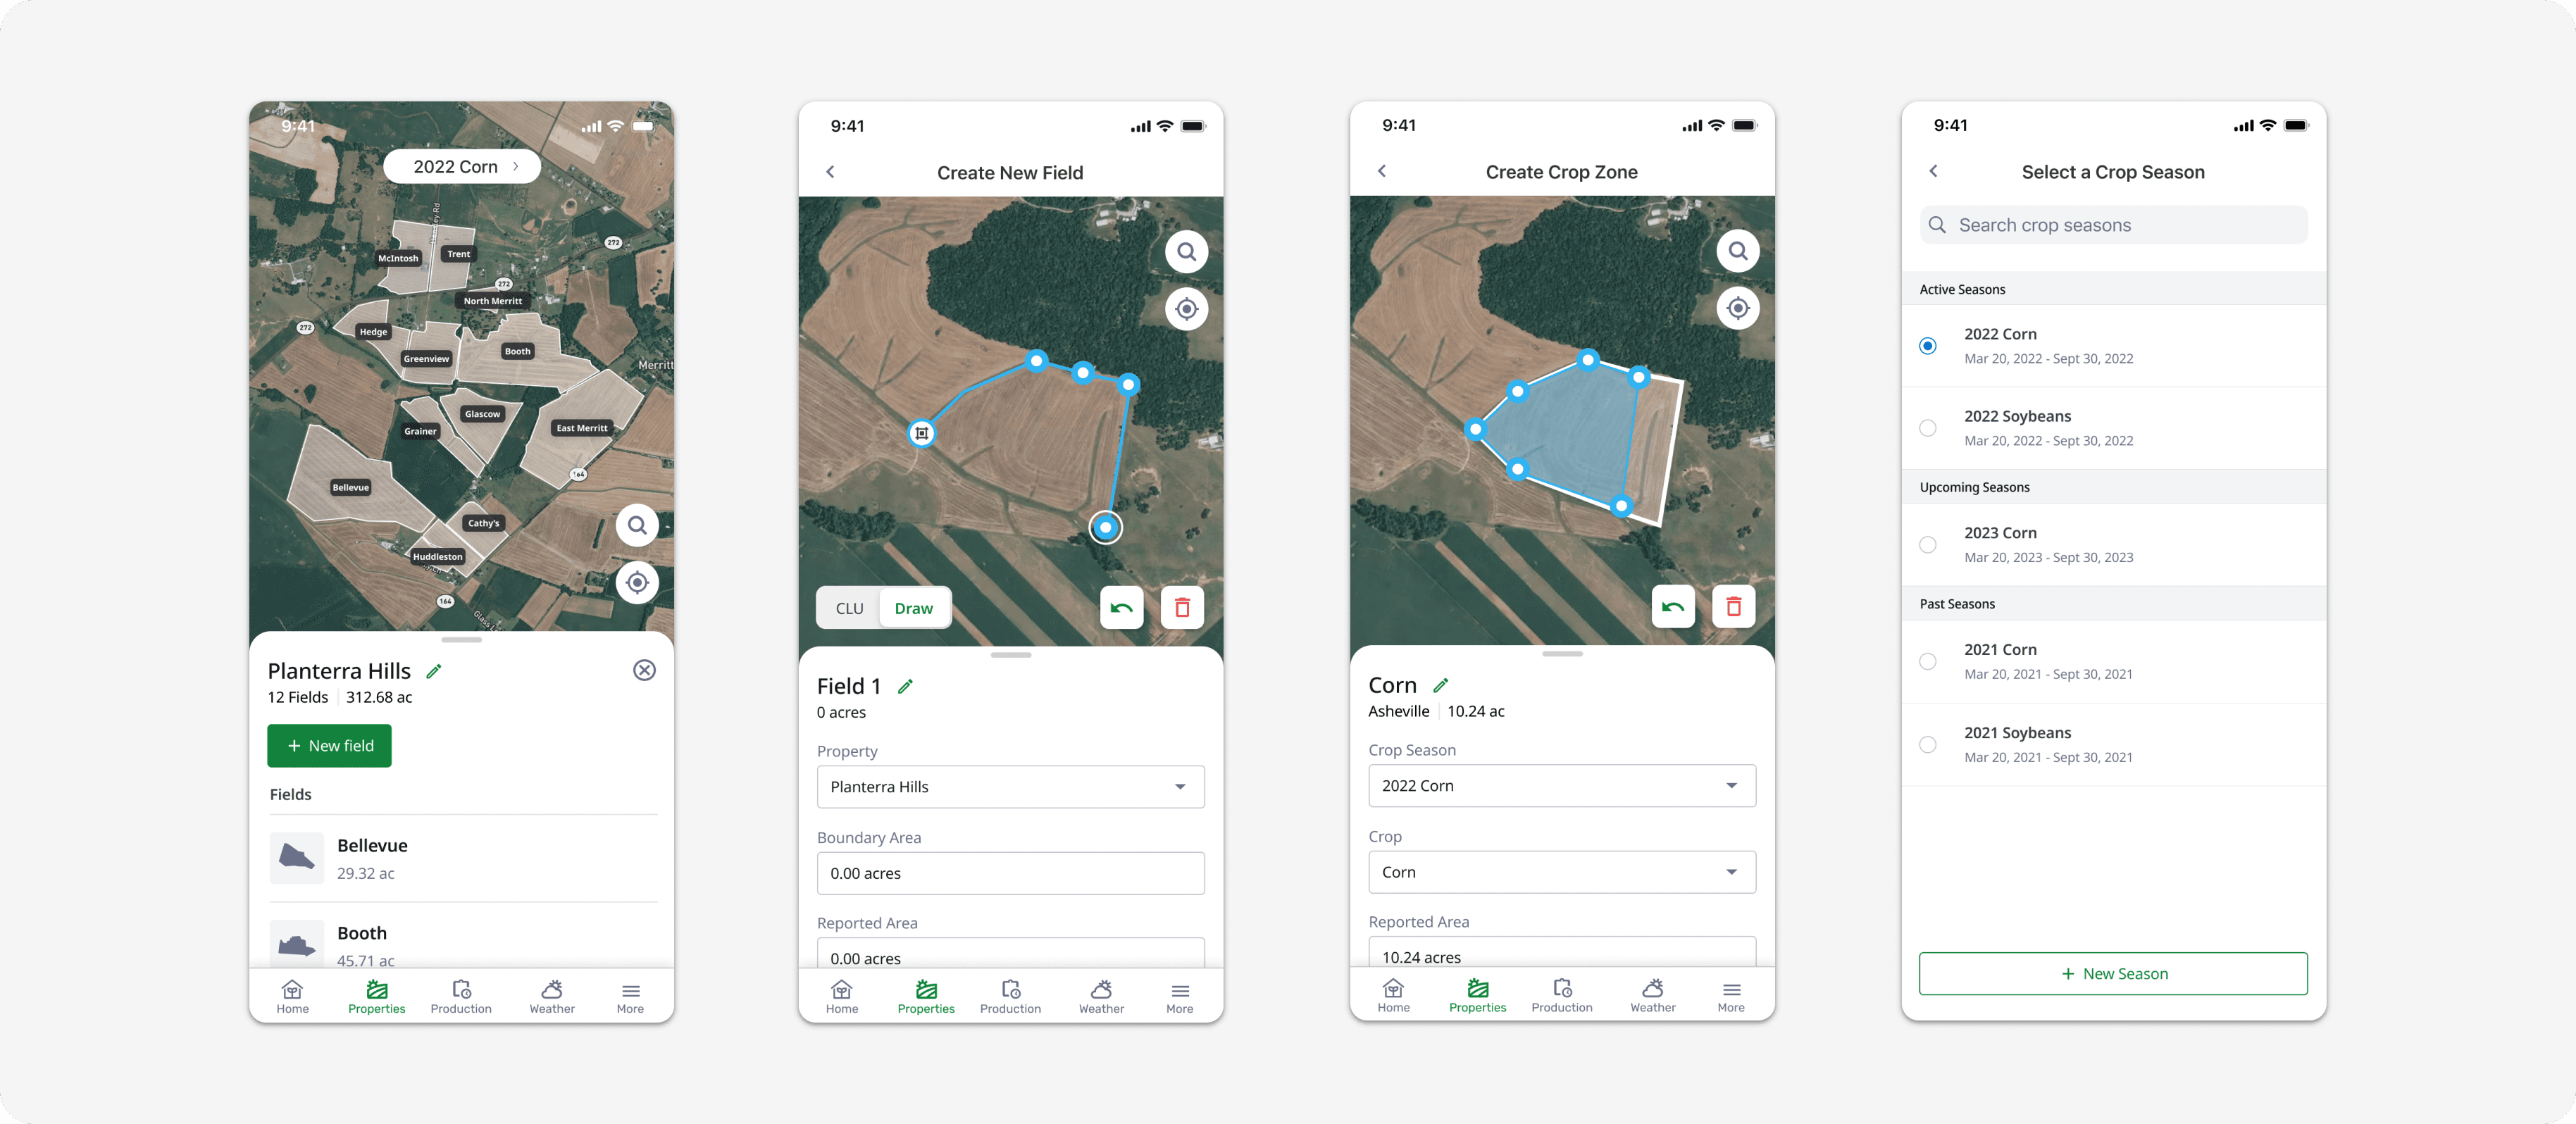
A native iOS adaptation of the same model, extending it to mobile's constraints for crop zones, multi-crop fields, and season switching
The product achieved over 1,000 new sign ups as a result of the redesign while also helping the business reach a landmark milestone in digital farmland recorded
The redesign drove over 1,000 new user memberships and helped the business reach 200 million acres of digitally connected farmland. It also built stakeholder confidence in UX research, backed by positive feedback from growers and stakeholders alike. Post-launch, I established a feedback loop with trainers and agronomists, began defining analytics metrics, and kept iterating based on user feedback through additional usability testing and research.